Getting Started with Klavena Integration
Before analyzing your financials, make sure you’ve connected your sales channels to QuickBooks Online via Klavena.
Follow our guide:
👉 Welcome to Klavena: Your First Steps
📊 Key Financial Reports in QuickBooks Online
QuickBooks provides multiple financial reports that help you understand your business performance. The two most important for e-commerce businesses are:
1. Balance Sheet
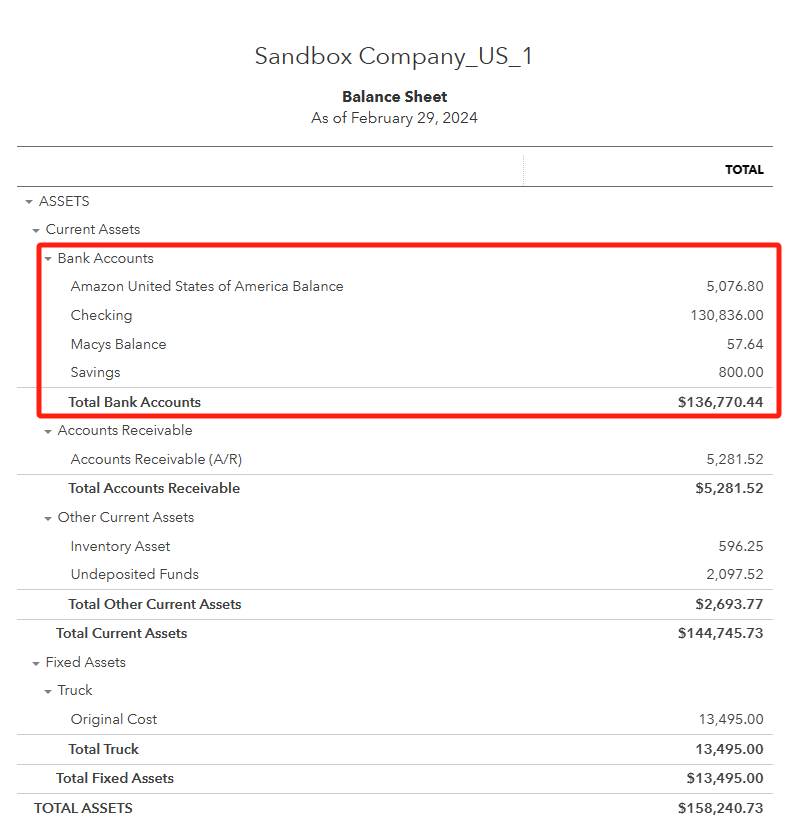
The Balance Sheet is a snapshot of your business’s financial position at a specific point in time. It lists your assets, liabilities, and equity.
How Klavena Helps:
- Tracks marketplace balances as separate bank accounts (e.g., Amazon, Walmart).
- Even before payout, marketplace-held funds are counted as assets—because they are owed to you.
- Tracks inventory value (if inventory tracking is enabled).
✅ Example: In QuickBooks, Klavena creates a “bank account” for each marketplace. When a payout happens, you simply record a transfer from the marketplace account to your real business bank account.
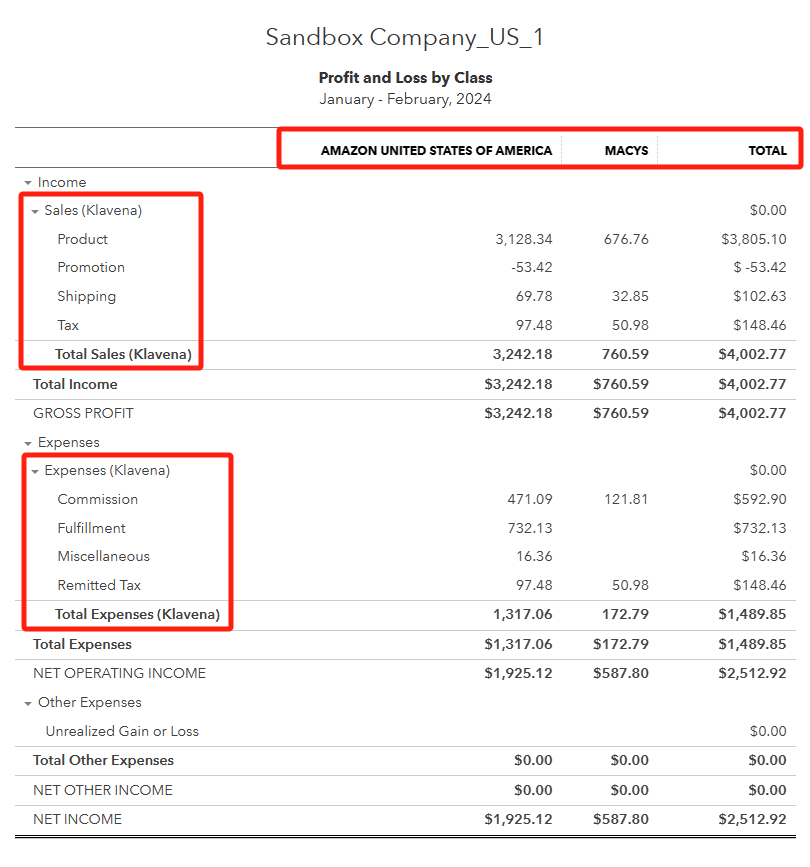
2. Profit & Loss (P&L) Statement
Also called the Income Statement, this report shows your revenue, expenses, and profit over a given time period.
How Klavena Helps:
- Categorizes income into accounts like:
Product Sales,Shipping Income,Tax Collected,Promotions, etc. - Categorizes expenses into accounts like:
Commission,Fulfillment,Storage Fees,Advertising,Remitted Tax.
✅ Tip:
If you're on QuickBooks Online Plus or Advanced, use the Profit & Loss by Class report to view profitability per sales channel (e.g., Amazon vs Shopify). Otherwise, use the regular P&L report.
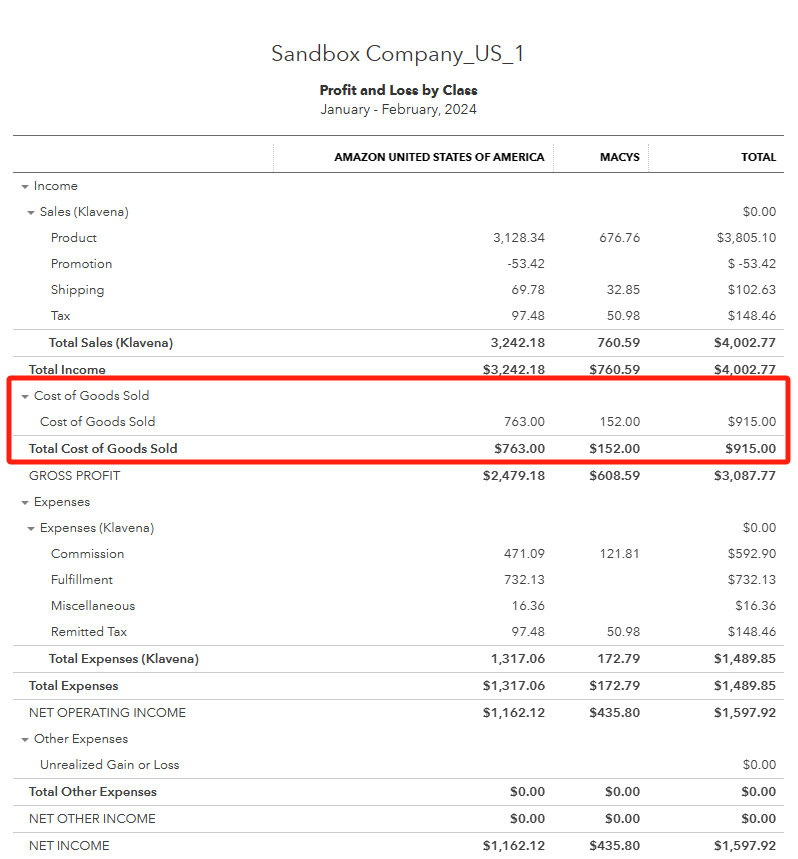
🧮 Enabling Inventory Tracking to View Cost of Goods Sold (COGS)
By default, QuickBooks does not show COGS in your P&L even if you’ve entered purchase transactions. This is because:
- COGS is only recorded when the item is sold (accrual method).
- QuickBooks can’t determine COGS unless inventory tracking is enabled.
📌 Steps to Enable COGS Tracking:
- Follow this guide to set up inventory tracking in Klavena and QuickBooks.
- Undo and re-import your existing settlements so that inventory data is included.
- After setup, your updated P&L report will now include COGS.
✅ Example:
Once inventory tracking is active, QuickBooks will subtract your cost of goods from revenue—giving you gross profit automatically.
💡 Summary: How Klavena Helps You Understand Your Financials
- Balance Sheet:
Shows what your business owns and owes at a specific point in time.
With Klavena, you can track:- Cash in your real bank accounts
- Funds held in sales channels (like Amazon or Walmart) as virtual bank accounts
- Inventory value (if inventory tracking is enabled)
- Cash in your real bank accounts
- Profit & Loss (P&L) Statement:
Displays your revenue, expenses, and profit over a given time period.
Klavena organizes this by:- Categorizing income (product sales, shipping, taxes, etc.)
- Categorizing expenses (commissions, fulfillment, advertising, etc.)
- Segmenting performance by sales channel (with QuickBooks Online Plus or Advanced)
- Categorizing income (product sales, shipping, taxes, etc.)
- COGS and Inventory Tracking:
To see Cost of Goods Sold (COGS) and gross profit in your P&L:- Enable inventory tracking in Klavena and QuickBooks
- Re-import settlements after setup
- QuickBooks will now automatically calculate and display COGS based on actual sales
- Enable inventory tracking in Klavena and QuickBooks