Running a successful ecommerce business requires more than just great products and marketing—it demands a deep understanding of your financial performance. While 43% of small businesses don't track their financial metrics consistently, those who do are 2.5 times more likely to achieve sustainable growth.Financial analytics provide the roadmap to profitability, helping you make data-driven decisions that can transform your business. Whether you're a startup founder or scaling an established store, mastering these essential metrics will give you the competitive edge needed to thrive in today's market.
Why Financial Analytics Matter for Ecommerce Success
Financial analytics go beyond basic accounting—they provide actionable insights that drive strategic decisions. Here's why they're crucial for ecommerce businesses:Performance Measurement: Track what's working and what isn't across all aspects of your businessPredictive Planning: Forecast future performance and plan for growth or challengesInvestment Decisions: Determine where to allocate resources for maximum ROIRisk Management: Identify potential issues before they become costly problemsCompetitive Advantage: Make informed decisions while competitors rely on guesswork
1. Revenue Metrics: The Foundation of Financial Success
Gross Revenue
Your total sales before any deductions. This metric shows your business's earning potential and growth trajectory.How to track: Monitor daily, weekly, and monthly revenue trendsIndustry benchmark: Aim for 20-30% month-over-month growth for scaling businessesOptimization tip: Focus on increasing both transaction volume and average order value
Net Revenue
Revenue after returns, refunds, and discounts. This provides a more accurate picture of your actual earnings.Formula: Gross Revenue - Returns - Refunds - DiscountsWhy it matters: Shows the true value delivered to customersAction step: If net revenue is significantly lower than gross, investigate return rates and discount strategies
Revenue Growth Rate
The percentage increase in revenue over a specific period.Formula: ((Current Period Revenue - Previous Period Revenue) / Previous Period Revenue) × 100Target: 10-25% monthly growth for healthy ecommerce businessesPro tip: Track growth rates across different time periods to identify seasonal patterns
2. Profitability Analytics: Understanding Your Bottom Line
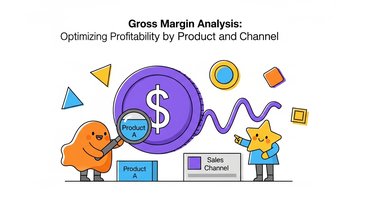
Gross Profit Margin
The percentage of revenue remaining after deducting the cost of goods sold (COGS).Formula: ((Revenue - COGS) / Revenue) × 100Industry average: 20-40% for most ecommerce businessesImprovement strategies: Negotiate better supplier terms, optimize inventory management, or adjust pricing
Net Profit Margin
Your bottom-line profitability after all expenses.Formula: (Net Profit / Revenue) × 100Healthy range: 5-15% for ecommerce businessesKey insight: This metric determines your business's long-term viability
Contribution Margin
The profit generated by each product after variable costs.Formula: (Revenue - Variable Costs) / Revenue × 100Use case: Identify your most profitable products and optimize your product mixStrategic application: Focus marketing efforts on high-contribution margin items
3. Customer Financial Metrics: Maximizing Customer Value
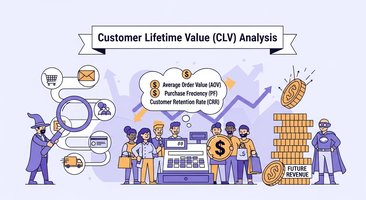
Customer Lifetime Value (CLV)
The total revenue a customer generates throughout their relationship with your business.Formula: Average Order Value × Purchase Frequency × Average Customer LifespanImportance: Determines how much you can spend on customer acquisitionOptimization: Increase through retention programs, upselling, and cross-selling
Customer Acquisition Cost (CAC)
The total cost to acquire a new customer.Formula: Total Marketing Spend / Number of New Customers AcquiredCritical ratio: CLV should be at least 3:1 compared to CACReduction strategies: Improve targeting, optimize conversion rates, leverage referrals
Average Order Value (AOV)
The average amount customers spend per transaction.Formula: Total Revenue / Number of OrdersGrowth tactics: Bundle products, implement minimum order thresholds, suggest complementary itemsImpact: Increasing AOV by 10% can boost profits by 30-50%
4. Cash Flow Analytics: Managing Your Financial Lifeline
Operating Cash Flow
The cash generated from core business operations.Calculation: Net Income + Non-Cash Expenses - Changes in Working CapitalHealthy indicator: Positive operating cash flow consistentlyManagement tip: Monitor this weekly to avoid cash crunches
Cash Conversion Cycle
The time it takes to convert inventory investments into cash receipts.Formula: Days Inventory Outstanding + Days Sales Outstanding - Days Payable OutstandingOptimization goal: Minimize this cycle to improve cash flowStrategies: Reduce inventory holding periods, speed up collections, extend payment terms with suppliers
Free Cash Flow
Cash available after necessary capital expenditures.Formula: Operating Cash Flow - Capital ExpendituresSignificance: Shows your ability to fund growth, pay dividends, or reduce debtTarget: Maintain positive free cash flow for sustainable growth
5. Inventory and Operations Analytics
Inventory Turnover Ratio
How quickly you sell and replace inventory.Formula: Cost of Goods Sold / Average Inventory ValueIndustry benchmark: 4-6 times per year for most ecommerce categoriesImprovement: Optimize demand forecasting and reduce slow-moving inventory
Gross Margin Return on Investment (GMROI)
The profit return on inventory investment.Formula: Gross Margin / Average Inventory CostTarget: 3.2 or higher for healthy inventory managementApplication: Identify which products generate the best returns
Stockout Rate
The percentage of time products are out of stock.Impact: Each stockout can cost 2-4% of potential salesOptimization: Implement automated reorder points and safety stock levelsTechnology solution: Use inventory management tools that integrate with your ecommerce platform
6. Marketing and Sales Analytics
Return on Advertising Spend (ROAS)
Revenue generated for every dollar spent on advertising.Formula: Revenue from Ads / Advertising SpendBenchmark: 4:1 ROAS is generally considered profitableChannel optimization: Track ROAS by platform to allocate budget effectively
Marketing Efficiency Ratio
The relationship between marketing spend and revenue growth.Formula: Revenue Growth / Marketing SpendStrategic use: Determine optimal marketing investment levelsInsight: Higher ratios indicate more efficient marketing spend
Conversion Rate by Channel
The percentage of visitors who make a purchase by traffic source.Tracking method: Use analytics tools to monitor each channel's performanceOptimization: Focus budget on highest-converting channelsImprovement: A/B test landing pages and checkout processes
7. Financial Health Indicators
Current Ratio
Your ability to pay short-term obligations.Formula: Current Assets / Current LiabilitiesHealthy range: 1.5-3.0 for most ecommerce businessesWarning sign: Ratios below 1.0 indicate potential liquidity issues
Debt-to-Equity Ratio
The balance between debt and equity financing.Formula: Total Debt / Total EquityConsideration: Higher ratios indicate more financial riskManagement: Maintain a balance that supports growth without excessive risk
Working Capital
The difference between current assets and current liabilities.Formula: Current Assets - Current LiabilitiesSignificance: Indicates short-term financial healthManagement: Ensure adequate working capital for operations and growth
Essential Tools for Financial Analytics
Accounting Software Integration
Modern ecommerce businesses need accounting software that integrates with their sales platforms. Popular options include:
- QuickBooks: Comprehensive accounting with ecommerce integrations
- Xero: Cloud-based accounting with strong automation features
- Klavena: Specialized ecommerce accounting automation that connects directly with your sales channels
Analytics Platforms
- Google Analytics: Free website and conversion tracking
- Shopify Analytics: Built-in analytics for Shopify stores
- Custom Dashboards: Combine data from multiple sources for comprehensive insights
Financial Reporting Tools
- Automated reporting: Set up regular financial reports
- Real-time dashboards: Monitor key metrics continuously
- Comparative analysis: Track performance against previous periods and industry benchmarks
How to Implement Financial Analytics in Your Business
Step 1: Establish Your Baseline
Before you can improve, you need to know where you stand. Collect historical data for all key metrics and establish current performance levels.
Step 2: Set Up Automated Tracking
Manual tracking is time-consuming and error-prone. Implement automated systems that capture and calculate your key metrics in real-time.
Step 3: Create Regular Reporting
Establish weekly, monthly, and quarterly reporting cycles. Different metrics require different review frequencies—cash flow needs daily monitoring, while profitability can be reviewed monthly.
Step 4: Set Performance Targets
Based on industry benchmarks and your business goals, set realistic but ambitious targets for each metric.
Step 5: Take Action on Insights
Analytics are only valuable if they drive action. Create processes to review metrics regularly and implement improvements based on your findings.
Common Financial Analytics Mistakes to Avoid
Focusing Only on Revenue
Revenue growth is important, but profitability matters more. A business can grow revenue while losing money—focus on metrics that show true financial health.
Ignoring Cash Flow
Many profitable businesses fail due to cash flow problems. Monitor cash flow as closely as profitability metrics.
Not Tracking Customer Metrics
Customer acquisition costs and lifetime value are crucial for sustainable growth. Don't neglect these customer-focused financial metrics.
Inconsistent Measurement
Ensure you're measuring metrics consistently across time periods. Changes in calculation methods can make trend analysis meaningless.
Advanced Financial Analytics Strategies
Cohort Analysis
Track customer behavior and value over time by grouping customers by acquisition date. This reveals trends in customer quality and lifetime value.
Predictive Analytics
Use historical data to forecast future performance. This helps with inventory planning, cash flow management, and growth projections.
Scenario Planning
Model different business scenarios (best case, worst case, most likely) to prepare for various outcomes and make contingency plans.
The Future of Ecommerce Financial Analytics
The landscape of financial analytics continues to evolve with new technologies and methodologies:Artificial Intelligence: AI-powered analytics provide deeper insights and automated recommendationsReal-time Processing: Instant data processing enables faster decision-makingIntegration Capabilities: Modern tools seamlessly connect with all aspects of your businessPredictive Modeling: Advanced algorithms forecast trends and identify opportunities
Taking Action: Your Next Steps
Financial analytics shouldn't be overwhelming—start with the basics and gradually expand your tracking capabilities:
- Implement basic tracking for the top 5-7 metrics most relevant to your business
- Set up automated reporting to save time and ensure consistency
- Review metrics weekly and adjust strategies based on insights
- Invest in proper tools that integrate with your existing systems
- Consider professional help for complex analytics or strategic planning
Conclusion: Transform Your Business with Financial Analytics
Mastering financial analytics is essential for ecommerce success in today's competitive landscape. By tracking the right metrics, using appropriate tools, and taking action on insights, you can optimize profitability, manage cash flow effectively, and drive sustainable growth.The businesses that thrive are those that make data-driven decisions based on comprehensive financial analytics. Start implementing these metrics today, and watch as your ecommerce business transforms from guesswork to strategic precision.Remember, financial analytics are not just about tracking numbers—they're about understanding your business deeply enough to make the strategic decisions that drive long-term success. The investment in proper financial analytics will pay dividends in improved profitability, better cash flow management, and accelerated growth.


