Ecommerce performance benchmarking transforms business guesswork into strategic intelligence. Companies using comprehensive benchmarking achieve:
- 45% better performance optimization
- 35% faster growth rates
- Strategic competitive advantages
- Data-driven decision making
Yet 71% of ecommerce businesses still lack systematic benchmarking processes.
The Competitive Stakes Are Higher Than Ever:
Rising Challenges:
• Customer expectations continue increasing
• Acquisition costs rise across all channels
• Market dynamics accelerate rapidly
• Competition intensifies globally
The Risk of Operating Blind:
• Celebrating mediocre results without context
• Panicking over normal fluctuations
• Missing optimization opportunities
• Poor strategic positioning
Benefits of Sophisticated Benchmarking:
- Strategic decision-making with context
- Competitive positioning advantages
- Performance optimization opportunities
- Market intelligence for growth
This comprehensive guide reveals how to transform performance measurement from internal reporting to strategic market intelligence. You'll discover industry benchmark standards, advanced comparison methodologies, and how platforms like Klavena's benchmarking system provide the sophisticated insights needed for competitive excellence in today's data-driven ecommerce landscape.
Understanding Ecommerce Performance Benchmarking
Ecommerce performance benchmarking involves systematically comparing business metrics against industry standards, competitor performance, and best-in-class examples to identify optimization opportunities and competitive positioning. This strategic analysis extends far beyond simple metric comparison to provide actionable insights that drive business improvement.
Effective benchmarking encompasses multiple performance dimensions simultaneously: financial metrics, operational efficiency, customer experience, marketing effectiveness, and strategic positioning. This comprehensive approach reveals the complex interrelationships between different performance areas and identifies optimization opportunities that single-metric analysis might miss.
Industry benchmarking provides external context that transforms internal metrics from abstract numbers into strategic insights. Understanding that your 2.5% conversion rate is above the industry average of 2.1% but below the top quartile of 3.8% provides actionable intelligence about performance positioning and improvement potential.
Competitive benchmarking adds another layer of strategic intelligence by comparing performance against specific competitors rather than industry averages. This analysis reveals competitive strengths and weaknesses that inform strategic positioning and resource allocation decisions.
Historical benchmarking tracks performance changes over time relative to industry trends, distinguishing between company-specific improvements and market-wide changes. This temporal analysis prevents misattribution of success or failure to internal factors when external market conditions drive performance changes.
The Strategic Value of Performance Benchmarking
Performance benchmarking provides strategic value that extends far beyond measurement:
Core Strategic Applications:
• Strategic planning optimization
• Resource allocation decisions
• Competitive positioning strategies
• Sustainable business growth drivers
Strategic Planning Benefits:
• Data-driven approach to goal setting
• Realistic performance targets based on industry data
• Achievable improvement opportunities identification
• Ambitious but credible goals that motivate teams
• Industry performance distributions understanding
Resource Allocation Optimization:
• Greatest improvement potential identification
• Investment decisions guided by benchmarks
• Highest competitive returns focus
• Performance area prioritization
• Strategic resource deployment
Competitive positioning insights emerge from benchmarking analysis that reveals relative strengths and weaknesses compared to industry standards and specific competitors. This intelligence informs marketing messaging, product development priorities, and strategic positioning decisions.
Performance validation provides objective assessment of business performance that removes emotional bias and provides realistic evaluation of success and failure. Benchmarking prevents both complacency with mediocre performance and panic over normal market fluctuations.
Investment justification becomes more compelling when benchmarking provides external validation of performance gaps and improvement opportunities. Investors and stakeholders respond more favorably to improvement initiatives supported by industry benchmark data.
Key Ecommerce Benchmarking Metrics
Conversion Rate Benchmarks
Conversion rate benchmarking provides fundamental insights into website effectiveness and customer experience quality, but accurate benchmarking requires understanding industry variations and contextual factors that affect conversion performance.
Industry-wide ecommerce conversion rates average 2.1-2.5%, but significant variations exist across product categories, price points, and business models. Fashion and beauty typically show lower conversion rates (1.8-2.2%) while electronics and automotive parts achieve higher rates (2.8-3.5%).
Device-specific conversion benchmarks reveal important optimization opportunities, with desktop conversion rates typically 50-100% higher than mobile rates. Understanding these patterns helps prioritize mobile optimization investments and set realistic performance expectations.
Traffic source conversion benchmarks show significant variations across acquisition channels, with organic search typically achieving the highest conversion rates (3-4%), followed by email (2-3%), and paid advertising (1.5-2.5%). These benchmarks guide marketing budget allocation and channel optimization priorities.
Geographic conversion benchmarks reveal regional performance variations that inform international expansion and localization strategies. Developed markets typically show higher conversion rates than emerging markets, but growth potential might be higher in developing regions.
Seasonal conversion benchmarks account for predictable fluctuations throughout the year, with holiday seasons typically showing 20-50% higher conversion rates than baseline periods. Understanding these patterns prevents misinterpretation of seasonal performance changes.
Average Order Value (AOV) Standards
Average order value benchmarking provides insights into customer spending patterns and pricing effectiveness, but interpretation requires understanding category-specific patterns and customer behavior variations.
Category-specific AOV benchmarks vary dramatically across ecommerce sectors, with luxury goods averaging $200-500+, electronics $150-300, fashion $50-150, and consumables $25-75. Understanding category norms provides realistic performance expectations and optimization targets.
Customer lifecycle AOV patterns typically show increasing order values over time as customers become more familiar with brands and products. New customer AOV often runs 20-30% below returning customer levels, providing insights into customer development opportunities.
Seasonal AOV fluctuations often correlate with gift-giving periods and promotional cycles, with holiday seasons typically showing 15-40% higher AOV than baseline periods. Understanding these patterns helps optimize promotional strategies and inventory planning.
Channel-specific AOV benchmarks reveal how different sales channels affect customer spending patterns, with direct-to-consumer typically achieving higher AOV than marketplace sales due to better customer experience control and reduced price competition.
Geographic AOV variations reflect local purchasing power and market maturity, with developed markets typically showing higher AOV than emerging markets. These insights inform pricing strategies and market entry decisions.
Customer Acquisition Cost (CAC) Benchmarks
Customer acquisition cost benchmarking provides critical insights into marketing efficiency and sustainable growth potential, but accurate interpretation requires understanding industry variations and customer lifetime value relationships.
Industry CAC benchmarks vary significantly by sector and business model, with B2B ecommerce typically showing higher CAC ($100-500) than B2C ($20-100) due to longer sales cycles and higher customer values. Understanding these norms helps evaluate marketing efficiency and budget allocation.
Channel-specific CAC benchmarks reveal significant variations across acquisition methods, with organic search typically showing the lowest CAC, followed by email marketing, social media, and paid search. These benchmarks guide marketing budget allocation and channel optimization priorities.
CAC payback period benchmarks indicate how quickly customer acquisition investments generate returns, with healthy ecommerce businesses typically achieving payback within 6-12 months. Longer payback periods might indicate inefficient marketing or low customer lifetime value.
CAC to LTV ratio benchmarks provide insights into sustainable growth potential, with healthy ratios typically ranging from 1:3 to 1:5 depending on business model and market maturity. Lower ratios might indicate overpriced acquisition while higher ratios suggest underinvestment in growth.
Cohort-specific CAC benchmarks reveal how acquisition costs change over time and vary by customer segments, providing insights into market saturation and optimization opportunities.
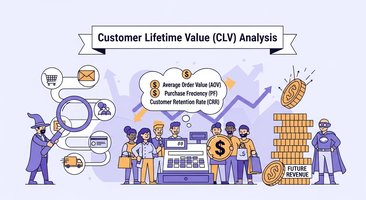
Customer Lifetime Value (CLV) Standards
Customer lifetime value benchmarking provides insights into long-term business sustainability and customer relationship quality, but accurate benchmarking requires understanding industry variations and calculation methodologies.
Industry CLV benchmarks vary dramatically by business model and category, with subscription businesses typically achieving higher CLV multiples than transactional businesses. Understanding these patterns helps evaluate customer relationship quality and business model effectiveness.
CLV to CAC ratio benchmarks provide insights into sustainable growth economics, with healthy ratios typically ranging from 3:1 to 5:1 depending on business model and market characteristics. These benchmarks guide customer acquisition investment decisions.
Customer segment CLV benchmarks reveal significant value variations within the same business, with top-tier customers often generating 5-10x more value than average customers. Understanding these patterns guides customer segmentation and retention strategies.
Retention rate benchmarks correlate strongly with CLV performance, with top-performing ecommerce businesses typically achieving 90-day retention rates of 25-35% and 12-month retention rates of 15-25%. These benchmarks provide targets for retention optimization efforts.
Geographic CLV benchmarks reveal regional customer value variations that inform market prioritization and localization investment decisions.
Industry-Specific Benchmarking
Fashion and Apparel
Fashion ecommerce shows unique performance characteristics that require specialized benchmarking approaches and industry-specific optimization strategies.
Conversion rate benchmarks in fashion typically range from 1.5-2.5%, lower than many categories due to fit concerns and higher return rates. However, top-performing fashion retailers achieve conversion rates of 3-4% through superior product presentation and customer experience.
Return rate benchmarks in fashion average 20-30%, significantly higher than most ecommerce categories. Understanding these patterns helps optimize product presentation, sizing information, and return policies to minimize returns while maintaining customer satisfaction.
Seasonal performance benchmarks show dramatic fluctuations in fashion, with back-to-school and holiday seasons typically generating 40-60% of annual revenue. These patterns require sophisticated inventory planning and marketing strategies.
Brand loyalty benchmarks in fashion show lower repeat purchase rates than many categories, with successful brands achieving 25-35% repeat purchase rates within 12 months. Building customer loyalty requires exceptional product quality and brand experience.
Social media influence benchmarks show higher impact in fashion than most categories, with social media driving 15-25% of traffic and conversions for successful fashion brands. This pattern requires sophisticated social media strategies and influencer partnerships.
Electronics and Technology
Electronics ecommerce demonstrates distinct performance patterns that reflect longer purchase consideration periods and higher transaction values.
Conversion rate benchmarks in electronics typically range from 2.5-4.0%, higher than many categories due to research-driven purchase behavior and clearer product specifications. Technical product information and comparison tools significantly impact conversion performance.
Average order value benchmarks in electronics typically range from $150-400, significantly higher than most ecommerce categories. This higher AOV enables different marketing strategies and customer acquisition approaches.
Customer research behavior benchmarks show longer consideration periods in electronics, with customers typically visiting 3-5 times before purchasing. This pattern requires sophisticated retargeting and nurturing strategies.
Seasonal performance benchmarks in electronics show strong holiday concentration, with Q4 typically generating 35-45% of annual revenue. Back-to-school periods also show significant performance spikes for certain product categories.
Technical support impact benchmarks show higher correlation between customer service quality and retention in electronics compared to other categories. Superior technical support becomes a competitive differentiator.
Home and Garden
Home and garden ecommerce shows seasonal patterns and customer behavior characteristics that require specialized benchmarking and optimization approaches.
Seasonal performance benchmarks show extreme variations, with spring and early summer generating 50-60% of annual revenue for many categories. This concentration requires sophisticated inventory planning and cash flow management.
Project-based purchase benchmarks show higher basket sizes during home improvement seasons, with customers often purchasing multiple related items. Cross-selling and bundling strategies show higher effectiveness in this category.
Geographic performance benchmarks show significant regional variations based on climate, housing characteristics, and lifestyle patterns. These variations require localized marketing and inventory strategies.
Customer lifetime value benchmarks show strong correlation with homeownership rates and property values, with suburban customers typically showing higher CLV than urban customers.
Mobile versus desktop benchmarks show higher desktop usage for research and large purchases, but increasing mobile adoption for smaller items and repeat purchases.
Health and Beauty
Health and beauty ecommerce demonstrates unique customer behavior patterns and performance characteristics that require specialized benchmarking approaches.
Subscription model benchmarks show higher adoption rates in health and beauty compared to other categories, with successful brands achieving 15-25% subscription rates among active customers.
Personalization impact benchmarks show higher effectiveness in beauty compared to other categories, with personalized product recommendations driving 20-30% higher conversion rates and customer satisfaction.
Influencer marketing benchmarks show exceptional effectiveness in beauty, with influencer-driven campaigns often achieving 2-3x higher engagement and conversion rates than traditional advertising.
Customer education content benchmarks show higher impact on conversion and retention in health and beauty, with educational content driving 25-40% higher customer lifetime value.
Regulatory compliance benchmarks require specialized attention in health categories, with compliance costs and restrictions affecting marketing strategies and performance comparisons.
Competitive Benchmarking Strategies
Identifying Key Competitors
Effective competitive benchmarking requires systematic identification of relevant competitors across different competitive dimensions rather than focusing solely on obvious direct competitors.
Direct competitors offer the most relevant performance comparisons but might not represent the full competitive landscape or emerging competitive threats. These competitors typically serve similar customer segments with similar products and business models.
Indirect competitors might serve the same customer needs through different products or approaches, providing insights into alternative business models and customer satisfaction approaches. These competitors often represent innovation opportunities or competitive threats.
Aspirational competitors represent best-in-class performance within the broader ecommerce landscape, providing stretch targets and innovation inspiration even if they operate in different categories or markets.
Emerging competitors include new entrants and rapidly growing businesses that might represent future competitive threats or partnership opportunities. Monitoring emerging competitors provides early warning of market changes and competitive developments.
Category leaders outside direct competition provide insights into best practices and innovation opportunities that might be applicable across different categories or business models.
Performance Gap Analysis
Performance gap analysis identifies specific areas where competitive performance differences create opportunities or threats that require strategic attention and resource allocation.
Quantitative gap analysis compares specific metrics like conversion rates, customer acquisition costs, and customer lifetime value to identify measurable performance differences that affect competitive positioning.
Qualitative gap analysis examines customer experience, brand positioning, and strategic capabilities that might not show up in quantitative metrics but affect long-term competitive positioning.
Root cause analysis investigates the underlying factors that create performance gaps, distinguishing between tactical execution differences and strategic positioning advantages that require different response strategies.
Opportunity prioritization ranks performance gaps based on potential impact, implementation difficulty, and strategic importance to guide resource allocation and improvement initiatives.
Competitive response strategies develop specific action plans to address performance gaps while building on competitive strengths and unique positioning advantages.
Market Share Analysis
Market share analysis provides context for performance benchmarking by revealing competitive positioning and market dynamics that affect individual business performance.
Category market share analysis reveals overall competitive positioning and identifies growth opportunities within specific product categories or customer segments.
Channel market share analysis shows competitive positioning across different sales channels and identifies opportunities for channel expansion or optimization.
Geographic market share analysis reveals regional competitive strengths and weaknesses that inform expansion strategies and resource allocation decisions.
Customer segment market share analysis identifies competitive positioning within specific customer groups and reveals opportunities for targeted competitive strategies.
Trend analysis tracks market share changes over time to identify competitive momentum and market dynamics that affect future strategic planning.
Technology and Tools for Benchmarking
Analytics and Reporting Platforms
Modern ecommerce benchmarking requires sophisticated analytics platforms that can collect, process, and analyze performance data while providing meaningful comparisons to industry standards and competitive performance.
Klavena's comprehensive benchmarking platform provides industry-leading performance comparison capabilities with automated benchmark data collection, peer group analysis, and actionable optimization recommendations that transform competitive intelligence into strategic advantage.
Google Analytics Intelligence provides basic industry benchmarking capabilities with automated insights and performance comparisons that help identify optimization opportunities and performance trends.
Adobe Analytics benchmarking features offer enterprise-level competitive analysis with advanced segmentation and comparison capabilities that provide sophisticated competitive intelligence.
Specialized benchmarking platforms like SimilarWeb, SEMrush, and Ahrefs provide competitive intelligence and market analysis that complement internal performance data with external market insights.
Custom analytics solutions enable sophisticated benchmarking analysis tailored to specific business models and competitive environments that require specialized comparison methodologies.
Competitive Intelligence Tools
Competitive intelligence tools provide external data and insights that enable comprehensive benchmarking analysis beyond internal performance metrics.
Website traffic analysis tools like SimilarWeb and Alexa provide insights into competitor traffic patterns, channel performance, and customer engagement that inform competitive benchmarking.
SEO analysis tools like Ahrefs and SEMrush reveal competitor search performance, keyword strategies, and content effectiveness that inform digital marketing benchmarking.
Social media monitoring tools track competitor social media performance, engagement rates, and content strategies that provide insights into brand building and customer engagement effectiveness.
Pricing intelligence tools monitor competitor pricing strategies and promotional activities that affect competitive positioning and performance comparisons.
Customer review analysis tools aggregate customer feedback across multiple platforms to provide insights into competitor customer satisfaction and service quality.
Data Integration Solutions
Effective benchmarking requires integration of internal performance data with external benchmark data and competitive intelligence to provide comprehensive performance analysis.
API integration solutions connect different data sources and platforms to enable comprehensive benchmarking analysis that incorporates all relevant performance dimensions and external data sources.
Data warehouse solutions aggregate benchmarking data from multiple sources to enable sophisticated analysis and reporting that provides actionable insights for strategic decision-making.
Business intelligence integration connects benchmarking insights with executive dashboards and reporting systems that enable strategic decision-making based on competitive performance analysis.
Real-time integration solutions enable dynamic benchmarking that continuously updates performance comparisons based on current data and changing market conditions.
Building Your Benchmarking Framework
Selecting Relevant Benchmarks
Effective benchmarking requires careful selection of relevant metrics and comparison groups that provide meaningful insights for strategic decision-making rather than overwhelming analysis with irrelevant comparisons.
Business model alignment ensures that benchmark comparisons account for fundamental business model differences that affect performance metrics and optimization strategies. B2B and B2C businesses require different benchmarking approaches.
Market maturity considerations account for differences between established and emerging markets that affect performance expectations and optimization priorities.
Competitive positioning analysis identifies the most relevant competitor groups for benchmarking based on strategic positioning, customer segments, and competitive dynamics rather than simple category classification.
Performance objective alignment connects benchmarking metrics to specific business objectives and strategic priorities to ensure that analysis provides actionable insights for improvement initiatives.
Resource constraint consideration ensures that benchmarking analysis focuses on areas where performance improvements are achievable given available resources and strategic priorities.
Establishing Baseline Measurements
Accurate benchmarking requires establishing reliable baseline measurements that provide the foundation for meaningful performance comparisons and trend analysis.
Data quality validation ensures that internal performance data meets accuracy and consistency standards required for meaningful benchmarking analysis. Poor data quality undermines benchmarking effectiveness and can lead to misguided strategic decisions.
Historical data collection establishes performance trends and seasonal patterns that provide context for benchmark comparisons and help distinguish between temporary fluctuations and meaningful performance changes.
Segmentation baseline development creates performance baselines for different customer segments, product categories, and business dimensions that enable more sophisticated benchmarking analysis.
Methodology documentation ensures that baseline measurements use consistent calculation methods and definitions that enable accurate trend analysis and benchmark comparisons over time.
Validation testing confirms that baseline measurements accurately represent business performance and provide reliable foundation for benchmarking analysis and strategic decision-making.
Creating Comparison Groups
Effective benchmarking requires creating appropriate comparison groups that provide meaningful performance context while accounting for business model and market differences that affect performance metrics.
Peer group identification creates comparison groups of businesses with similar characteristics, market positioning, and competitive environments that provide the most relevant benchmark comparisons.
Industry segment analysis develops benchmarking groups based on product categories, customer segments, and business models that share similar performance drivers and optimization opportunities.
Size-based grouping accounts for scale differences that affect performance metrics and optimization strategies, ensuring that benchmarking comparisons account for business size and resource differences.
Geographic segmentation creates regional comparison groups that account for market maturity, competitive dynamics, and customer behavior differences across different geographic markets.
Performance tier analysis creates comparison groups based on performance levels rather than business characteristics, providing aspirational targets and best practice identification opportunities.
Interpreting Benchmarking Results
Statistical Significance and Context
Accurate benchmarking interpretation requires understanding statistical significance and contextual factors that affect performance comparisons and strategic implications.
Sample size considerations ensure that benchmark comparisons are based on sufficient data to provide statistically reliable insights rather than random variations that might mislead strategic decision-making.
Confidence interval analysis provides insights into the range of likely performance outcomes and helps distinguish between meaningful performance differences and statistical noise.
Seasonal adjustment accounts for predictable performance variations that affect benchmark comparisons and helps identify underlying performance trends versus seasonal fluctuations.
Market condition context considers external factors like economic conditions, competitive dynamics, and industry trends that affect performance comparisons and strategic implications.
Business lifecycle stage analysis accounts for differences between startup, growth, mature, and declining businesses that affect appropriate benchmark comparisons and performance expectations.
Identifying Improvement Opportunities
Effective benchmarking analysis identifies specific improvement opportunities that provide actionable insights for performance optimization and strategic development.
Performance gap prioritization ranks improvement opportunities based on potential impact, implementation difficulty, and strategic importance to guide resource allocation and initiative planning.
Root cause analysis investigates the underlying factors that create performance gaps to identify appropriate improvement strategies rather than addressing symptoms without understanding causes.
Quick win identification highlights improvement opportunities that can be implemented rapidly with minimal resources to generate momentum and demonstrate benchmarking value.
Strategic initiative development creates longer-term improvement plans that address fundamental performance gaps and competitive positioning challenges identified through benchmarking analysis.
Success measurement planning establishes metrics and timelines for tracking improvement initiative effectiveness and validating benchmarking insights through actual performance improvements.
Action Planning and Implementation
Benchmarking analysis only creates value when insights translate into specific actions and performance improvements rather than remaining as analytical reports.
Strategic priority alignment connects benchmarking insights to business strategy and resource allocation decisions to ensure that improvement initiatives receive appropriate attention and resources.
Implementation roadmap development creates specific timelines, resource requirements, and success metrics for benchmarking-driven improvement initiatives.
Cross-functional coordination ensures that benchmarking insights inform decision-making across all relevant business functions rather than remaining isolated within analytics or strategy teams.
Performance monitoring systems track improvement initiative effectiveness and provide feedback on benchmarking analysis accuracy and strategic value.
Continuous improvement processes regularly update benchmarking analysis and improvement strategies based on performance results and changing market conditions.
Advanced Benchmarking Techniques
Cohort-Based Benchmarking
Cohort-based benchmarking provides more sophisticated performance analysis by comparing customer groups with similar characteristics rather than aggregate business performance.
Customer acquisition cohort benchmarking compares the performance of customers acquired during similar time periods or through similar channels to identify optimization opportunities and performance trends.
Behavioral cohort benchmarking analyzes customers with similar behavior patterns to understand performance drivers and identify improvement strategies that address specific customer segments.
Geographic cohort benchmarking compares performance across different regions or markets to identify localization opportunities and regional optimization strategies.
Product affinity cohort benchmarking analyzes customers with similar product preferences to optimize product development, marketing, and customer experience strategies.
Lifecycle stage cohort benchmarking compares customer performance at different stages of the customer relationship to optimize retention and development strategies.
Predictive Benchmarking
Predictive benchmarking uses historical performance data and market trends to forecast future benchmark performance and identify emerging optimization opportunities.
Trend extrapolation analysis uses historical benchmark data to predict future performance standards and identify areas where current performance might become inadequate.
Competitive trajectory analysis forecasts competitor performance improvements to identify areas where competitive gaps might widen without proactive improvement initiatives.
Market evolution modeling predicts how industry benchmarks might change due to technological advancement, customer behavior evolution, and competitive dynamics.
Performance scenario planning creates multiple benchmark scenarios based on different market conditions and competitive developments to guide strategic planning and resource allocation.
Early indicator analysis identifies leading performance indicators that predict future benchmark changes and provide advance warning of required strategic adjustments.
Multi-Dimensional Analysis
Multi-dimensional benchmarking analyzes performance across multiple metrics simultaneously to identify complex performance patterns and optimization opportunities that single-metric analysis might miss.
Correlation analysis identifies relationships between different performance metrics that reveal optimization opportunities and help prioritize improvement initiatives based on potential impact across multiple performance dimensions.
Cluster analysis groups businesses or performance periods based on multiple performance characteristics to identify patterns and benchmarking groups that provide more relevant comparison insights.
Principal component analysis identifies the underlying factors that drive performance variations across multiple metrics, providing insights into fundamental performance drivers and optimization priorities.
Performance index development combines multiple performance metrics into composite scores that provide holistic performance assessment and benchmarking comparison.
Trade-off analysis examines how improvements in one performance area affect other metrics to identify optimization strategies that maximize overall business performance rather than sub-optimizing individual metrics.
Future of Ecommerce Benchmarking
Real-Time Benchmarking
The future of ecommerce benchmarking involves real-time performance comparison that enables dynamic optimization and immediate response to competitive changes and market opportunities.
Streaming analytics platforms process performance data as it occurs, providing immediate benchmarking insights that enable rapid strategic adjustments and competitive responses.
Automated alert systems notify managers when performance deviates significantly from benchmark standards or when competitive gaps emerge that require strategic attention.
Dynamic benchmark updates continuously adjust performance standards based on current market conditions and competitive developments rather than relying on static historical benchmarks.
Real-time competitive intelligence integrates current competitor performance data with internal metrics to provide up-to-date competitive positioning insights and optimization opportunities.
Predictive benchmarking algorithms forecast near-term benchmark changes based on current trends and market conditions to enable proactive strategic planning and competitive positioning.
AI-Powered Insights
Artificial intelligence and machine learning are transforming benchmarking from descriptive analysis to predictive intelligence that identifies optimization opportunities and competitive threats before they become obvious.
Automated pattern recognition identifies complex performance patterns and benchmarking insights that human analysis might miss, providing more comprehensive competitive intelligence and optimization opportunities.
Natural language processing analyzes customer feedback, market research, and competitive intelligence to provide qualitative benchmarking insights that complement quantitative performance data.
Predictive modeling forecasts performance changes and competitive developments based on current trends and market conditions, enabling proactive strategic planning and competitive positioning.
Recommendation engines suggest specific improvement initiatives based on benchmarking analysis and successful optimization strategies from similar businesses or market conditions.
Continuous learning systems improve benchmarking accuracy and insight quality over time by learning from prediction accuracy and business outcomes.
Privacy-Compliant Benchmarking
Evolving privacy regulations and consumer preferences require new approaches to benchmarking that maintain analytical value while respecting customer privacy and complying with regulatory requirements.
Aggregate data analysis provides benchmarking insights without requiring individual customer data sharing, enabling industry-wide performance comparison while protecting customer privacy.
Federated learning approaches enable collaborative benchmarking analysis across multiple businesses without sharing sensitive customer or business data.
Differential privacy techniques provide benchmarking insights while protecting individual business and customer information from identification or competitive intelligence gathering.
Consent-based benchmarking ensures that performance analysis only includes data from customers and businesses that have explicitly agreed to participate in benchmarking studies.
Anonymization technologies enable benchmarking analysis that protects business identity while providing valuable performance comparison and optimization insights.
Conclusion
Ecommerce performance benchmarking has evolved from simple metric comparison to sophisticated competitive intelligence that drives strategic decision-making and sustainable competitive advantage. Companies that master benchmarking achieve significantly better performance through data-driven optimization, strategic positioning, and competitive response strategies.
The key to benchmarking success lies in systematic data collection, sophisticated analytical methodologies, and strategic implementation of insights across all business functions. Modern platforms like Klavena democratize advanced benchmarking by automating complex analytical processes while providing actionable insights that drive measurable business improvements.
The future of ecommerce benchmarking involves greater automation, real-time analysis, and AI-powered insights that create more responsive and effective competitive intelligence. Businesses that invest in sophisticated benchmarking capabilities today will be best positioned to maintain competitive advantages in an increasingly data-driven and competitive marketplace.
Success with performance benchmarking requires commitment to data quality, analytical rigor, and systematic implementation of insights across strategic planning, resource allocation, and operational optimization. Companies that develop these capabilities gain sustainable competitive advantages through superior market intelligence and strategic decision-making.
As ecommerce competition intensifies and market dynamics accelerate, sophisticated performance benchmarking becomes increasingly critical for maintaining competitive positioning and identifying growth opportunities. The businesses that master benchmarking will thrive while those that operate without external reference points will struggle to optimize performance and compete effectively in the data-driven marketplace.