Cost of Goods Sold optimization separates profitable ecommerce businesses from those struggling with margin erosion and competitive disadvantages. Companies with sophisticated COGS management achieve 15-25% better gross margins, improved pricing flexibility, and enhanced financial performance compared to those using basic cost tracking methods.
Yet 68% of ecommerce businesses lack comprehensive COGS optimization strategies, leading to hidden profit losses averaging $75,000 annually for mid-size companies. The complexity of modern ecommerce operations makes accurate COGS calculation increasingly challenging while simultaneously more critical for competitive success.
The stakes continue rising as customer acquisition costs increase and competitive pressures intensify. Businesses that fail to optimize COGS find themselves caught between rising costs and pricing pressure, gradually eroding profitability until growth becomes unsustainable.
Modern ecommerce COGS includes far more than basic product costs. Marketplace fees, shipping costs, packaging expenses, payment processing fees, and fulfillment charges all impact true product profitability. Many businesses discover their "profitable" products actually generate losses when all costs are properly allocated.
This comprehensive guide reveals proven strategies for optimizing COGS, improving margin visibility, and leveraging platforms like Klavena's automated COGS calculation to maintain accurate cost tracking across complex ecommerce operations.
Understanding Ecommerce COGS Components
Cost of Goods Sold for ecommerce businesses encompasses all direct costs associated with producing and delivering products to customers, requiring sophisticated tracking across multiple cost categories and channels.
Core COGS Elements:
Product Acquisition Costs form the foundation of COGS calculation. For retailers, this includes wholesale purchase prices, volume discounts, and payment terms that affect cash flow and effective costs. Manufacturers must include raw materials, direct labor, and manufacturing overhead allocated to specific products.
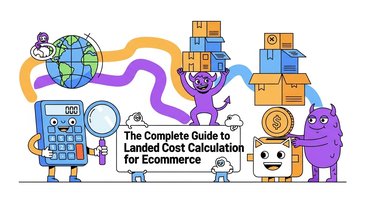
Landed Cost Components significantly impact total product costs, especially for international sourcing. Shipping and freight charges, customs duties and taxes, insurance costs, and currency exchange fluctuations can add 15-30% to base product costs. Many businesses underestimate these components, leading to pricing decisions based on incomplete cost information.
Fulfillment and Logistics Costs represent increasingly significant COGS components in modern ecommerce operations. Warehousing expenses, picking and packing labor, packaging materials, and outbound shipping costs directly relate to product delivery and should be included in comprehensive COGS calculations.
Channel-Specific Costs:
Different sales channels carry distinct cost structures that affect product profitability. Amazon FBA fees include storage, fulfillment, and referral charges that vary by product category and size. eBay seller fees and PayPal processing charges impact net profitability differently than direct website sales.
Marketplace advertising costs become increasingly important COGS components as organic visibility declines. Amazon PPC, Google Shopping, and Facebook advertising costs directly tied to specific products should be allocated appropriately to understand true product profitability.
Third-party logistics costs vary significantly by provider and service level. Pick and pack fees, storage charges, and shipping markups from 3PL providers must be accurately tracked and allocated to maintain precise COGS calculations.
Hidden Cost Categories:
Many businesses overlook significant cost components that affect true product profitability. Returns processing costs include reverse logistics, inspection labor, restocking fees, and product refurbishment expenses that reduce net margins. Customer service costs associated with specific products or categories should be considered in comprehensive profitability analysis.
Quality control and inspection costs ensure product standards but impact overall profitability. Product photography, listing creation, and content development costs contribute to product launch expenses that should be amortized across expected sales volumes.
COGS Calculation Methods and Best Practices
Accurate COGS calculation requires systematic approaches that capture all relevant costs while providing actionable insights for optimization and pricing decisions.
Inventory Valuation Methods
FIFO (First-In, First-Out) Method:
FIFO assumes the oldest inventory is sold first, which typically results in lower COGS during inflationary periods as older, cheaper inventory costs are matched against current sales. This method provides higher gross margins on financial statements and better inventory valuation on balance sheets during rising cost environments.
The method works particularly well for businesses with perishable products or fashion items where physical rotation matches accounting treatment. Technology products with rapid obsolescence also benefit from FIFO's assumption that older inventory moves first.
However, FIFO may not reflect current market conditions in COGS calculations, potentially leading to pricing decisions based on outdated cost information. During periods of rapid cost increases, FIFO can overstate profitability and lead to inadequate pricing adjustments.
LIFO (Last-In, First-Out) Method:
LIFO assumes the newest inventory is sold first, resulting in higher COGS during inflationary periods as recent, higher costs are matched against current sales. This method provides more conservative profit reporting and better matching of current costs with current revenues.
The approach offers tax advantages during inflation by reducing taxable income through higher COGS. Cash flow benefits result from lower tax payments that can be reinvested in business operations or expansion.
LIFO complexity increases with multiple product lines and varying cost patterns. The method requires detailed record-keeping and can create artificial profits if older, lower-cost inventory layers are liquidated.
Weighted Average Method:
Weighted average calculates a single average cost for all inventory units, providing simplified administration and smoothed cost fluctuations. The method eliminates extreme COGS variations caused by timing differences in inventory purchases.
This approach works well for bulk commodities and similar products where individual unit tracking isn't critical. Small businesses often prefer weighted average for its simplicity and reduced administrative burden.
The method may not provide optimal tax benefits or margin visibility compared to FIFO or LIFO in volatile cost environments. Strategic pricing decisions may suffer from lack of detailed cost visibility that other methods provide.
Activity-Based Costing Implementation
Cost Driver Identification:
Activity-based costing allocates indirect costs based on actual resource consumption rather than arbitrary allocation methods. Order processing costs can be allocated based on order complexity, customer type, or fulfillment requirements. Customer service expenses might be allocated based on product return rates, complexity, or support requirements.
Warehousing costs can be allocated based on storage space requirements, handling complexity, or turnover rates rather than simple percentage allocations. This precision provides better insights into true product profitability and pricing requirements.
Technology and System Costs:
Modern ecommerce operations require significant technology investments that should be appropriately allocated to products and channels. Platform fees, integration costs, and software subscriptions contribute to overall cost structure and affect pricing decisions.
Data processing and analytics costs support inventory management, demand forecasting, and optimization activities that benefit specific products or categories. Marketing technology costs for email platforms, CRM systems, and analytics tools should be allocated based on usage patterns and benefit received.
Klavena's Automated COGS Calculation
Real-Time Cost Tracking:
Klavena automatically captures and calculates COGS components across all sales channels and cost categories. The platform integrates with supplier systems, marketplace platforms, and fulfillment providers to ensure all cost components are included in real-time calculations.
Automated cost allocation eliminates manual calculations and reduces errors that can significantly impact profitability analysis. Multi-channel integration ensures consistent COGS calculation regardless of sales channel or fulfillment method.
Comprehensive Cost Integration:
Klavena includes often-overlooked cost components such as marketplace fees, payment processing charges, advertising costs, and fulfillment expenses in comprehensive COGS calculations. Currency conversion and international shipping costs are automatically calculated and allocated appropriately.
Historical cost tracking provides trend analysis and identifies cost increases that require pricing adjustments or supplier negotiations. Predictive cost modeling helps businesses anticipate future cost changes and adjust strategies proactively.
Margin Analysis and Optimization Strategies
Effective COGS optimization requires comprehensive margin analysis that identifies opportunities for improvement across products, channels, and operational processes.
Product-Level Profitability Analysis
Individual Product Performance:
Detailed product-level analysis reveals which items generate the highest returns and which may require strategic changes. Gross margin by product provides the foundation for pricing decisions and product mix optimization. Contribution margin analysis considers variable costs and helps identify products that contribute most to fixed cost coverage and profit generation.
Product lifecycle profitability analysis considers how margins change over time as products mature, competition increases, or costs evolve. New product launch costs should be amortized appropriately to avoid distorting short-term profitability analysis.
Category and Brand Analysis:
Product category performance reveals broader trends and opportunities that individual product analysis might miss. Brand profitability comparison helps optimize supplier relationships and product mix decisions. Private label vs. branded product analysis often reveals significant margin opportunities.
Seasonal profitability patterns help optimize inventory investments and promotional strategies. Cross-selling and bundling analysis identifies opportunities to improve overall customer profitability through strategic product combinations.
Channel Optimization Strategies
Sales Channel Profitability:
Different sales channels carry distinct cost structures that significantly impact product profitability. Direct website sales typically offer the highest margins but may require higher marketing investments. Amazon sales provide volume but include substantial fees that must be factored into profitability calculations.
eBay and marketplace sales offer market reach but include various fees and reduced control over customer relationships. Wholesale and B2B channels may offer lower margins but provide volume and reduced marketing costs.
Customer Acquisition Cost Integration:
Channel-specific acquisition costs should be considered in comprehensive profitability analysis. Organic vs. paid traffic profitability differs significantly and affects channel strategy decisions. Customer lifetime value by channel provides insights into long-term profitability that single-transaction analysis might miss.
Return and refund rates by channel affect net profitability and should be included in channel optimization decisions. Customer service costs vary by channel and customer type, impacting overall profitability calculations.
Cost Reduction Strategies and Implementation
Systematic cost reduction requires strategic approaches that maintain quality and customer satisfaction while improving profitability and competitive positioning.
Supplier Relationship Optimization
Strategic Sourcing and Negotiation:
Effective supplier relationships begin with comprehensive market analysis that identifies alternative sources and negotiation leverage. Volume consolidation across suppliers can generate significant cost savings through improved pricing tiers and terms.
Payment term optimization improves cash flow while potentially reducing costs through early payment discounts. Long-term contracts can provide cost stability and better pricing in exchange for volume commitments and partnership arrangements.
Quality and Cost Balance:
Supplier quality programs ensure cost reductions don't compromise product quality or customer satisfaction. Total cost of ownership analysis considers quality costs, returns, and customer service impacts alongside purchase prices.
Supplier development programs help partners improve efficiency and reduce costs while maintaining quality standards. Collaborative forecasting and planning reduce supplier costs and improve service levels through better demand visibility.
Operational Efficiency Improvements
Fulfillment Optimization:
Packaging optimization reduces material costs while maintaining product protection and customer experience. Shipping consolidation and carrier optimization can significantly reduce fulfillment costs through better rates and service selection.
Warehouse efficiency improvements reduce labor costs per unit while improving accuracy and speed. Inventory positioning optimization reduces shipping costs by storing products closer to customers or in lower-cost facilities.
Process Automation:
Order processing automation reduces labor costs while improving accuracy and speed. Inventory management automation prevents stockouts and overstock situations that increase costs and reduce profitability.
Quality control automation reduces inspection costs while maintaining or improving quality standards. Returns processing automation reduces handling costs while improving customer satisfaction and inventory recovery.
Technology-Driven Cost Reduction
Data Analytics and Optimization:
Demand forecasting improvements reduce inventory carrying costs while maintaining service levels. Price optimization algorithms identify opportunities to improve margins without sacrificing volume.
Supplier performance analytics identify opportunities for cost reduction through better supplier selection and management. Customer behavior analysis reveals opportunities for cross-selling, upselling, and retention that improve overall profitability.
Integration and Efficiency:
System integration reduces manual effort and errors while improving data accuracy and decision-making speed. Automated reporting provides real-time insights that enable rapid response to cost increases or margin opportunities.
Workflow optimization eliminates redundant processes and reduces labor costs while improving consistency and quality. Exception management systems identify issues quickly and enable proactive resolution before they impact costs or customer satisfaction.
Advanced Analytics and Performance Monitoring
Sophisticated analytics provide insights that drive continuous improvement and competitive advantage in COGS optimization and margin management.
Key Performance Indicators
Financial Metrics:
Gross margin trends by product, category, and channel provide insights into profitability patterns and optimization opportunities. COGS as percentage of sales reveals overall cost efficiency and competitive positioning.
Margin variance analysis identifies products or periods where actual margins differ from targets, enabling rapid response to cost increases or pricing opportunities. Contribution margin analysis helps optimize product mix and resource allocation decisions.
Operational Metrics:
Cost per order analysis reveals fulfillment efficiency trends and optimization opportunities. Returns cost analysis identifies products or processes that require attention to reduce total cost impact.
Supplier performance metrics including cost trends, quality indicators, and service levels guide supplier management and sourcing decisions. Inventory turnover by cost category reveals working capital efficiency and optimization opportunities.
Predictive Analytics and Forecasting
Cost Trend Analysis:
Predictive cost modeling helps businesses anticipate supplier cost increases and adjust pricing or sourcing strategies proactively. Market trend analysis provides insights into industry cost patterns and competitive dynamics that affect pricing power.
Seasonal cost patterns help optimize inventory timing and supplier negotiations. Economic indicator correlation analysis helps predict cost changes based on broader economic trends and conditions.
Optimization Recommendations:
Machine learning algorithms analyze complex relationships between costs, pricing, and profitability to identify optimization opportunities. Scenario modeling helps evaluate the impact of different cost reduction strategies and pricing changes.
Automated alerts notify managers when costs exceed thresholds or margins fall below targets, enabling rapid response to changing conditions. Performance benchmarking compares costs and margins against industry standards and competitors.
Implementation Framework and Best Practices
Successful COGS optimization requires systematic implementation that addresses technology, processes, and organizational capabilities while maintaining operational continuity.
Implementation Phases
Phase 1: Current State Analysis (Month 1-2)
Begin with comprehensive cost audit that identifies all current cost components and allocation methods. Data collection from all systems and sources ensures complete cost visibility and accuracy.
Gap analysis compares current practices with best practices and identifies improvement opportunities. Baseline establishment provides benchmarks for measuring improvement progress and success.
Phase 2: System and Process Design (Month 3-4)
Technology selection and implementation provides foundation for accurate cost tracking and analysis. Process standardization ensures consistent cost capture and allocation across all products and channels.
Training and change management prepare teams for new processes and systems while ensuring user adoption and success. Testing and validation confirm system accuracy and process effectiveness before full deployment.
Phase 3: Optimization and Enhancement (Month 5-6)
Advanced analytics implementation provides insights that drive continuous improvement and competitive advantage. Automation deployment reduces manual effort while improving accuracy and consistency.
Performance monitoring systems provide real-time insights that enable rapid response to changing conditions and opportunities. Continuous improvement processes ensure ongoing optimization and adaptation to changing business requirements.
Success Factors and Common Pitfalls
Critical Success Factors:
Executive commitment and cross-functional collaboration ensure successful implementation and ongoing optimization. Data quality and system integration provide the foundation for accurate analysis and decision-making.
User training and change management ensure successful adoption and utilization of new processes and systems. Continuous monitoring and improvement processes drive ongoing optimization and competitive advantage.
Common Implementation Pitfalls:
Incomplete cost capture leads to inaccurate profitability analysis and poor decision-making. Over-complexity in allocation methods can reduce accuracy and user adoption while increasing administrative burden.
Insufficient training and change management result in poor user adoption and system utilization. Lack of ongoing monitoring and optimization allows performance to deteriorate over time and reduces competitive advantage.
Conclusion and Strategic Recommendations
COGS optimization represents a critical competitive advantage that directly impacts profitability, pricing flexibility, and strategic positioning. Companies that master comprehensive cost management achieve superior financial performance while maintaining competitive advantages that drive sustainable growth.
Key Strategic Priorities:
Comprehensive cost visibility forms the foundation for all optimization efforts and strategic decisions. Real-time tracking and automated calculation ensure accuracy while reducing administrative burden and enabling rapid response to changing conditions.
Cross-functional collaboration between operations, finance, and strategy teams ensures cost optimization aligns with broader business objectives and customer satisfaction requirements. Continuous improvement culture drives ongoing optimization and adaptation to changing market conditions.
Technology enablement through platforms like Klavena provides scalable solutions that grow with business complexity while maintaining accuracy and insight quality. Performance measurement and benchmarking ensure ongoing competitive advantage and optimization success.
Implementation Recommendations:
Start with comprehensive cost audit that establishes baseline performance and identifies immediate improvement opportunities. Prioritize high-impact areas that offer significant margin improvement potential with reasonable implementation complexity.
Invest in technology infrastructure that provides scalable foundation for growth while maintaining accuracy and insight quality. Develop organizational capabilities through training and process improvement that ensure sustainable competitive advantage.
Monitor performance continuously and adapt strategies based on changing market conditions and business requirements. Benchmark against industry standards and competitors to ensure ongoing competitive positioning and optimization success.
Klavena's COGS Solution:
Klavena provides comprehensive COGS optimization through automated cost tracking, real-time calculation, and advanced analytics that ensure accuracy while providing actionable insights. The platform integrates seamlessly with existing systems while providing scalable solutions that grow with business complexity.
Getting Started:
Klavena makes COGS optimization straightforward with comprehensive assessment, proven implementation methodology, and ongoing optimization support. The platform delivers immediate improvements in cost visibility and margin analysis while providing foundation for long-term competitive advantage.
COGS optimization complexity increases with business growth and market evolution, but the right strategies and technology can transform this challenge into sustainable competitive advantage. Start optimizing your COGS today – the margin improvements and strategic insights create compounding benefits that justify immediate investment and commitment to excellence.